
The Financial Review got very excited overnight when it was able to run an “exclusive” headlined “Wage growth drives inflation, average pay tops $100k” based on a Treasury document.
The story had everything the Fin could possibly want — proof that workers, not gouging corporations, are responsible for inflation, and evidence of just how greedy workers really are, that they’re now being paid six-figure salaries. An economist from one of the big four conflict of interest and tax dodging firms, Ernst & Young, was wheeled out to warn that such indulgence would cause interest rates to remain higher for longer.
In fact, there wasn’t much new to the story because it was just a later version of a Treasury document released last year that also purported to show profits play no role in inflation.
And if you actually bother to look at the Treasury chart the AFR chose to accompany the story, you’ll see something very odd: its account of inflation is made up of “labour costs”, “direct shocks”, imports, “indirect shocks” (fuel and freight imports) and residual.
Where’s “profits”? There’s no mention of profits at all. Profits simply don’t exist in Treasury’s decomposition of inflation. Nor do taxes. Apparently, in Treasury’s modelling, increases in taxes — like changes in fuel excise — don’t have any inflationary impact — at least none worth breaking out. Weirdly, Treasury actually criticised the Australia Institute for not including tax in its modelling last year.
As Treasury stated in the 2023 briefing, it’s a “stylised decomposition.” And “labour costs are the single largest cost to firms, and historically have usually been the single greatest contributor to inflation as a result.” So Treasury just assumes labour costs are the biggest contributor to inflation as part of its stylisation — which kind of detracts from the entire point of today’s article, but never mind.
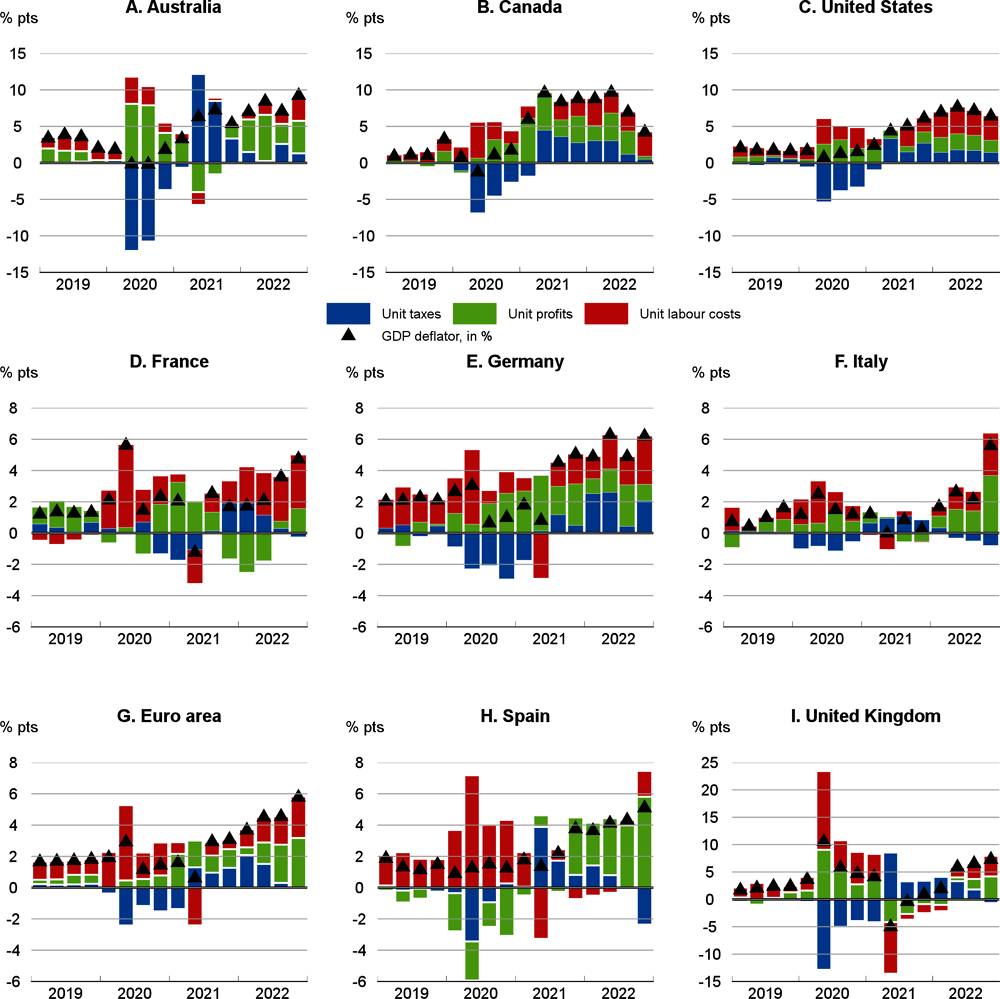
For a more insightful assessment of drivers of inflation in Australia, we can look to the OECD, which last year published an analysis of drivers of inflation in several major economies, including our own. Both taxes and profits exist in the OECD’s decomposition, which examines unit profits, unit taxes and unit labour costs, and showed unit profits as the dominant driver of inflation across 2022 — an assessment completely at odds with Treasury’s.
Strangely enough, what’s missing in today’s report from the AFR is something that Treasury devoted considerable attention to last year. Despite insisting that profits weren’t driving inflation, Treasury admitted “there is evidence of declining dynamism in Australian markets” and mark-ups by firms had increased across the 2000s and 2010s. “Firms with high mark-ups relative to other firms in their industries appeared to account for a disproportionate share of output, suggesting that they are larger. This finding is consistent with other findings that markups are directly related to the share of the market held by the firm.”
So, big firms are able to increase mark-ups and the problem has been getting worse for the last two decades. Sadly, that didn’t make it into the AFR on either occasion it reported what Treasury said. Wonder why.


As Alan K keeps reminding us, the RBA is blind – partly I suppose because of its brief. but when trying to kill the poor, and productive people in our society takes a sledgehammer, while a bit of sensible hard hitting legislation by a Labor (left wing – Ha Ha Ha Has) govt, which most of us hoped to see after the last 10 yrs of train wreck LNP, would make big inroads. Courage????
If people actually read the Treasury analysis, it explicitly addresses the OCED analysis, stating that the aggregates for Australia are highly distorted by the mining sector, which is profitable but not a large domestic driver of demand.
In fact, Treasury are as about open as they can in this current political environment – to quote:
“Unlike other advanced economies, an increase in labour supply in Australia means that wages growth did not contribute to above target inflation”
“Labour costs” includes the number of workers, which is rising rapidly due to high migration. Cut that and it would address a lot of the inflation problem.
It’s worth further noting that this analysis is nearly a year old, and based off data ending 2022. So it is a bit out of date (since then, real wages have started rising and policy is actively swing back towards workers).
Do labour costs include the fees paid to the labour hire organisations? If so, that’s not what’s going to the worker so is not a wage cost but a business/consulting cost.
…which kind of detracts from the entire point of Treasury.
I spent a week doing some work with some SES people from Revenue Group some years back. I was astonished to learn that all the big multi-national companies we hear don’t pay tax in fact do pay lots of tax (really?), and that population growth was a great way to drive economic growth, and they were all for it.
I want to know what proportion of the salary bill is made up of CEOs and senior executives, as their salaries drag up the average to suggest that workers are all well paid. What’s the median salary as opposed to the average or mean? What’s the standard deviation and what is the spread across the range of salaries? We need to see a scatterplot as well as a clear description of the population sampled for the statistic quoted. What industries (unlikely to be hospitality!)? etc etc….