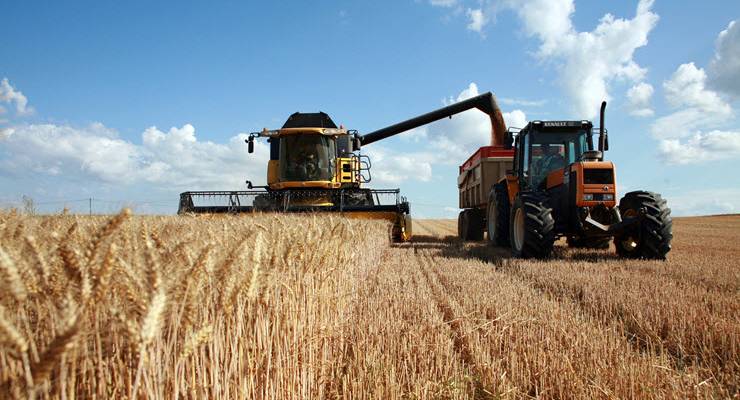
While the National Party holds the future of Australia’s climate policy hostage, it’s worth looking closer at exactly who it represents. The Nationals vote has been in decline for years now, from 11.5% of the first preference vote in 1987 under leader Ian Sinclair, to 4.5% in the most recent federal election under the leadership of Michael McCormack.
This shrinking vote share is neatly correlated with the rising urbanisation of Australia. Aussies live in cities now. So who do the Nats represent? They wear farmer hats, but there are fewer and fewer farmers in Australia.
As the next chart shows, the number of people employed in agriculture, fishing and forestry is down sharply from its highs in the early 1990s.

Look at how that green line is rising — that’s part-time work. Many casual and seasonal workers are bulking up the employment statistics, especially in fruit and vegetable farming, less so in cattle and sheep farming.
According to the 2016 census, the number of farmers in Australia is 141,419 (including farm managers). It simply isn’t that many. The agricultural labour force also includes around 50,000 overseas workers.
The states with the highest share of agricultural employment are the three big east coast states — NSW, Victoria and Queensland, where the National Party wins seats. The Nats have seven NSW seats, three Victorian seats, and are part of the Queensland Liberal National Party, which has 16 of the 18 seats outside urban Brisbane.
Victoria is notable as the state that has in recent years had the highest share of agricultural work, as the next graph shows. So do the Nationals do well there? Not especially. The Liberal Party has a stranglehold on a number of country seats and one of Australia’s few independents holds the rural seat of Indi.

It’s not clear the Nationals represent farmers much any more. So who do they represent? Miners?
The farming industry is a bigger employer than mining, as the next chart shows. In Victoria, farms employ ten times as many people as mining. Most states have more farm workers than miners. (You can spot the blip in mining employment around 2012, during the mining boom.)

In Western Australia the reverse is true, with mining employing more than farming, but that doesn’t seem to be winning the Nationals any votes over there. The National Party holds no House of Representatives Seats for WA and has no senators in the state.
The National Party claims to stand for “building stronger regional economies” as “the only political party dedicated to advancing the interests of regional Australia”.
So what are the jobs in the regions?
The next graph uses a comparison to gives the answer: in the region around Barnaby Joyce’s seat of New England, employment is in healthcare, social assistance and farming. In the region around Anthony Albanese’s seat of Grayndler, employment is in professional services, retail, healthcare and construction.

It is very hard for governments to stimulate job growth in the regions. I worked for a time at an organisation called Regional Development Victoria, and it is unclear if we achieved any development of the regions of Victoria whatsoever.
But what a government can’t do, a pandemic sometimes can.
Jobs in the regions are likely to grow if workers continue to flee the cities, liberated by remote working. Those changes will make the profile of country jobs look more like city jobs. And if that happens, the Nationals might find their electoral situation looking even more precarious.


Crikey is committed to hosting lively discussions. Help us keep the conversation useful, interesting and welcoming. We aim to publish comments quickly in the interest of promoting robust conversation, but we’re a small team and we deploy filters to protect against legal risk. Occasionally your comment may be held up while we review, but we’re working as fast as we can to keep the conversation rolling.
The Crikey comment section is members-only content. Please subscribe to leave a comment.
The Crikey comment section is members-only content. Please login to leave a comment.